Two years ago, we found ourselves completely captivated by the perfect intersection of data hoarding, write-once Python, and shiny graphs as, inspired by the 2018 EMBER paper, we began gathering, parsing, and analysing malicious and benign binaries. We eventually discussed this process and our findings at Steelcon 2024 in our talk, Statistical Inconspicuousness, where we sought to identify what a new implant would have to do to blend into the contemporary landscape of goodware. Our hope was that this analysis would both inform and inspire the creation of better payloads as well as give blue teams pointers for further attributes and behaviours for static malware analysis.
Our preliminary findings were pretty cool, but out of a mix of life and burnout, we’ve been long overdue a follow-up. But last week, Ember 2024 was released as a part of EMBER2024 - A Benchmark Dataset for Holistic Evaluation of Malware Classifiers which rekindled our interest in this topic. We began updating and expanding our 2024 data set, updating our review process, and performing further analysis techniques drawing on the EMBER2024 paper, EMBER2024 - A Benchmark Dataset for Holistic Evaluation of Malware Classifiers as well as other research published since our last talk. Ultimately, what we want to do in this and in upcoming blogs is look at the state of software from a static perspective and see what we can learn to create better malware, and better ways of differentiating between malware and benign executables. We’ll look at how we collected our samples, how we created the dataset, and then explore and document our initial and heavily procrastinated-upon findings using our updated approach.
Data gathering
As with so many projects, pulling the data is the hardest part of this problem – making sure that our samples are broadly consistent and that they reflect an appropriate breadth and depth of the full population. In our processing, we differentiated our samples into two main categories before setting out to find as many examples as we could:
| Category | Description |
|---|---|
| Malicious binaries ("malware") | Software that is intentionally malicious in nature, such as viruses, trojans, worms, and all that good stuff that keeps us employed. |
| Benign binaries ("goodware") | Software that is not intended to harbour bad intentions, such as shared or dedicated libraries (i.e. .dlls) or applications like Spotify, Outlook, or Minecraft. Within this section, we include native Microsoft Windows binaries as well as those made by third parties (i.e. everyone else who develops for Windows). |
Collecting malware samples
We started with malware. Malware is easy to get, centralised, and available all over the Internet. While many helpful sites offer to give you malware free, one implant at a time, we found several established organisations with extensive malware collections. We collected our samples from the following datasets:
- Sophos ReversingLabs 20 million dataset SOREL-20M
- Abuse.ch and Spamhaus' MalwareBazaar
- The inimitable VX-Underground
The Sophos Reversinglabs SOREL-20M dataset was and is the most convenient malware dataset which we found, as it contains (unsurprisingly) 20 million samples which were all readily downloadable from Amazon S3. However, as detailed in their blog, Sophos-ReversingLabs (SOREL) 20 Million sample malware dataset, the samples within the dataset were disarmed by stripping the Subsystem and FileHeader.Machine header values, which could potentially impact our analysis by reducing the available metadata held within the subsystem field.
For malware samples, we reviewed complete binaries, with the OptionalHeader.Subsystem flag and the FileHeader.Machine header value both set to 0 to prevent accidental execution.
Collecting goodware samples
Goodware is a lot harder to come by, validated goodware even more so. For goodware, we used a mix of sources for our talk:
- National Software Reference Library (NSRL)
- Various configurations, versions, and distributions of Microsoft Windows and Microsoft Windows server.
- Typical Microsoft software, including applications, services, libraries, and other distributables.
- Chocolatey
- ninite
The National Software Reference Library (NSRL) database maintains a list of hashes for vendor-submitted applications. With those hashes, the challenge is to then find the file itself. For us, we found the Hybrid Analysis API worked to let us pull the original binaries. We also made use of other publicly available assistants; we some simply scripts to pull the versions of binaries from Chocolatey, the package manager for Windows, as well as (fewer) samples from Ninite, the initial installation assistant. We also grabbed as much as we could from our Windows lab environments, including several desktop and server installations of Windows, as well as many roles and services which we could install on them.
This dataset is by no means a complete representation of all available or accessible goodware samples. We should note, as EMBER do, that the licensing and distribution of goodware, unlike (most!) malware, is considerably more restrictive, and we would encourage the responsible and ethical construction of a more complete goodware dataset to be left as an exercise for the endeavouring reader.
Data Parsing
With our new samples covering both malware and goodware, we built a parser to replicate the work of ember and build a dataset with similar features. For a comprehensive walkthrough of how we approached automating the static review of the samples, see Mez0's blog, "Citadel: Binary Static Analysis Framework". In lieu of re-creating the whole blog here, our parsing aimed to review each binary and highlight features from their metadata and data, including:
- Imports
- Exports
- Optional Headers
- Sections
- Entropy (both for the file and section by section)
- File Size
- Toolchains (compilers, linkers, etc)
- Code Signing
- TLS
- Symbols
- Hashing (TLSH and SHA256)
One thing we found we couldn't get was malware families. Perhaps Citadel could be updated to do this for us, but it would take some time to develop and execute - perhaps we will explore this in the future. If you have any ideas with how we might accomplish this, please reach out!
From this effort, we managed to get a total of 644,140 samples, split between 613,879 samples of malware and 30,261 samples of goodware.
Malware vs Benign Distribution
Exploration
So now we’ve shown how we collated and parsed our datasets, let’s step through what we found when we parsed them, and what our initial thoughts and theories were as we stepped through the datasets.
Architecture
The easiest place to start is with architecture. Let's take a look at how our dataset splits between x64 and x86 for both malware and goodware.
First, malware:
| architecture | count |
|---|---|
| x64 | 613878 |
| unknown | 1 |
And goodware:
| architecture | count |
|---|---|
| x64 | 19880 |
| x86 | 10380 |
Malware Architecture
Goodware Architecture
Interestingly, for malware we have 613,878 samples as x64 and 1 unknown. Whereas, with goodware, it’s a bit more evenly split with 19,880 x64, and 10,380 x86 samples. As an anecdotal note, this matched our feelings as authors, but the totality of the split was a surprise. From a development perspective, watching the lowest common denominator of supported languages slowly creep up has been as relieving as it has been useful (here’s looking at you, .NET Core) and architecturally x64 has been around for a fair while but even so, it’s a surprise to see such a definitive absence of x86 samples. We can’t definitively rule out odd behaviours with how samples are submitted to datasets with this one but frankly, we’re not too sure but we are suspicious.
Sections
Using the PE Format debug page as a basid for officially implemented section names, we can directly compare the size and entropy of like sections, as well as use the section names as a list to check for unofficial and/or unconventional sections.
| Section Name | Description |
|---|---|
.bss |
Uninitialized data (free format) |
.cormeta |
CLR metadata that indicates that the object file contains managed code |
.data |
Initialized data (free format) |
.debug\$F |
Precompiled debug types (object only) |
.debug\$P |
Debug types (object only) |
.drective |
Linker options |
.edata |
Export tables |
.idata |
Import tables |
.idlsym |
Includes registered SEH (image only) to support IDL attributes. For information, see "IDL Attributes" in References at the end of this topic. |
.pdata |
Exception information |
.rdata |
Read-only initialized data |
.reloc |
Image relocations |
.rsrc |
Resource directory |
.sbss |
GP-relative uninitialized data (free format) |
.sdata |
GP-relative initialized data (free format) |
.srdata |
GP-relative read-only data (free format) |
.sxdata |
Registered exception handler data (free format and x86/object only) |
.text |
Executable code (free format) |
.tls |
Thread-local storage (object only) |
.tls\$ |
Thread-local storage (object only) |
.vsdata |
GP-relative initialized data (free format and for ARM, SH4, and Thumb architectures only) |
.xdata |
Exception information (free format) |
If we take all the sections from the data and put it into a JSON object where each section has a list of entropy and size values, we can then use those lists to create some averages. The table below summarises that data.
| Category | Section | Avg Entropy | Avg Size | Count |
|---|---|---|---|---|
| malware | .debug | 5.599858881 | 1,012,552.8 | 137 |
| goodware | .text | 5.99365007 | 537,000.02 | 26,145 |
| malware | .text | 6.255716132 | 336,903.23 | 432,768 |
| goodware | .rdata | 4.705207915 | 226,824.54 | 23,371 |
| malware | .data | 3.280598217 | 149,298.42 | 379,834 |
| malware | .rsrc | 4.559958375 | 146,393.03 | 484,761 |
| malware | .srdata | 4.981952522 | 136,572.06 | 17 |
| malware | .pdata | 4.818058259 | 54,359.147 | 4,849 |
| goodware | .rsrc | 3.750977196 | 53,179.795 | 26,683 |
| malware | .rdata | 3.163208936 | 53,070.413 | 313,326 |
| goodware | .sdata | 3.921923155 | 37,741.714 | 14 |
| goodware | .data | 2.340989243 | 30,988.398 | 21,827 |
| malware | .reloc | 4.213806253 | 27,759.143 | 168,621 |
| goodware | .pdata | 4.402602734 | 25,858.914 | 16,340 |
| malware | .xdata | 3.217135004 | 14,411.245 | 1,411 |
| goodware | .edata | 2.842691873 | 12,260.046 | 3,294 |
| goodware | .xdata | 3.685339784 | 12,046.871 | 4,166 |
| goodware | .srdata | 4.38643325 | 11,264 | 1 |
| goodware | .reloc | 3.060418737 | 9,458.8093 | 24,658 |
| malware | .vsdata | 7.449222236 | 8,704 | 6 |
| malware | .sdata | 3.220623313 | 7,756.0462 | 2,164 |
| malware | .idata | 4.63734346 | 7,036.8053 | 79,044 |
| goodware | .idata | 4.103264093 | 6,982.353 | 5,858 |
| malware | .edata | 2.25954688 | 6,845.2301 | 8,202 |
| malware | .sbss | 3.50447763 | 6,205.594 | 133 |
| malware | .tls | 0.040064223 | 2,008.0996 | 64,565 |
| malware | .bss | 0.055536247 | 1,615.1944 | 30,283 |
| malware | .sxdata | 0.065376136 | 1,122.807 | 228 |
| goodware | .tls | 0.069993845 | 616.55076 | 4,285 |
| goodware | .sxdata | 0.020393135 | 512 | 6 |
| goodware | .debug | 4.830524203 | 155.39474 | 114 |
| goodware | .bss | 0.002617006 | 46.669959 | 4,860 |
| malware | .cormeta | 0 | 0 | 0 |
| malware | .drective | 0 | 0 | 0 |
| malware | .idlsym | 0 | 0 | 0 |
Firstly, the .text section, which typically contains executable code, shows notably higher average entropy in malware (6.26) than in goodware (5.99), which we would theorise is due to heavier obfuscation and/or packing in malicious binaries. Additionally, while malware .text sections are more numerous, goodware versions are on average larger, possibly reflecting more extensive legitimate codebases.
The .rsrc section is substantially larger and more frequent in malware. Its higher average entropy in malware (4.56 vs. 3.75) implies frequent misuse for embedding obfuscated or encrypted payloads. Conversely, .rdata, usually reserved for read-only data, shows a reversed trend: goodware has higher average entropy and larger size, potentially due to richer embedded constants or resources.
Goodware exhibits minimal use of some sections entirely absent in malware, such as .srdata (1 instance only) and .sxdata, although their low counts limit statistical interpretation.
Finally, the .debug section is disproportionately large in malware despite being rare, with an average size exceeding 1MB. This is unusual since debug symbols are generally stripped in production binaries; it may reflect intentional misuse or misclassification.
Overall, differences in section entropy and size offer useful signals for distinguishing malware from goodware, especially when considering packing behaviours and section utilization patterns. Reviewing this with our developer hats on, we couldn’t help but think this was due to malware authors pulling from a smaller pool of knowledge and online examples, potentially leading to less variation than goodware. For example, consider how many pentesters you know who use the ippsec nmap flag order.
Let's now do the inverse, taking this section names and only looking at the ones which we do not recognise - that gives us the following:
| Category | Section | Occurrences | Average Entropy | Average Size |
|---|---|---|---|---|
| Malware | UPX1 | 102,029 | 6.3956 | 258,974.7 |
| Malware | UPX0 | 101,995 | 2.1948 | 92,005.05 |
| Malware | .code | 55,950 | 4.8622 | 2,850.94 |
| Malware | UPX2 | 50,166 | 2.805 | 854.52 |
| Malware | .imports | 42,889 | 4.0734 | 2,590.39 |
| Malware | DATA | 39,116 | 4.7043 | 174,271.7 |
| Malware | CODE | 38,718 | 6.5981 | 493,990.7 |
| Malware | BSS | 38,157 | 0.0092 | 185.73 |
| Malware | .bak | 34,906 | 7.0183 | 6,780.43 |
| Malware | .NewSec | 28,482 | 0.2099 | 1,613.08 |
| Goodware | .CRT | 3,116 | 0.2378 | 517.92 |
| Goodware | .buildid | 2,328 | 0.5503 | 512 |
| Goodware | /4 | 1,657 | 1.6041 | 13,968.92 |
| Goodware | _RDATA | 1,059 | 2.9316 | 8,441.47 |
| Goodware | .qtmetad | 1,016 | 2.122 | 519.06 |
| Goodware | .00cfg | 880 | 0.2986 | 512 |
| Goodware | .gfids | 571 | 0.662 | 1,149.53 |
| Goodware | /19 | 305 | 5.647 | 147,435.9 |
| Goodware | /45 | 282 | 5.2452 | 31,549.73 |
| Goodware | .didat | 275 | 1.2737 | 1,967.94 |
Malware samples exhibit a high prevalence of non-standard sections like UPX1, UPX0, and UPX2, which are indicative of UPX-packed executables. UPX1 shows very high entropy (6.40) which is consistent with packed files. Other sections like .bak and .NewSec suggest the use of injected or renamed sections, with .bak showing suspiciously high entropy (7.02), further hinting at obfuscation or polymorphism.
Conversely, goodware exhibits fewer and more consistent non-standard sections with lower entropy and smaller sizes, such as .buildid, and .00cfg. These sections are generally used for benign metadata or runtime configurations. The limited variation and low entropy in goodware indicate transparency and predictability, in contrast to the diverse and entropy-heavy nature of malware sections. Overall, the data underscores entropy and anomalous section naming as strong indicators for distinguishing malicious binaries from legitimate ones.
File Size
File size is another interesting component as this is often associated with both evasion and detection. We've seen bloaters increase the size of a file so that vendors don't scan it, we've seen tiny executables to have nothing to scan, etc. lets do some analysis on the dataset and see what we have.
| Category | Total Files | Min Size | Max Size | Mean Size | Median Size | Std Dev |
|---|---|---|---|---|---|---|
| Malware | 613,879 | 512.00 B | 30.00 MB | 1.45 MB | 688.07 KB | 2.41 MB |
| Goodware | 30,261 | 0.00 B | 29.99 MB | 757.79 KB | 84.39 KB | 2.37 MB |
| Category | Size Range | File Count | Percentage |
|---|---|---|---|
| Malware | 0-1MB | 364,101 | 59.30% |
| Malware | 1-5MB | 219,760 | 35.80% |
| Malware | 5-10MB | 22,795 | 3.70% |
| Malware | 10-50MB | 7,223 | 1.20% |
| Malware | >50MB | 0 | 0.00% |
| Goodware | 0-1MB | 26,119 | 86.30% |
| Goodware | 1-5MB | 3,114 | 10.30% |
| Goodware | 5-10MB | 600 | 2.00% |
| Goodware | 10-50MB | 428 | 1.40% |
| Goodware | >50MB | 0 | 0.00% |
Malware exhibits a broader and heavier size distribution than goodware. While 59.3% of malware samples fall under 1MB, a significant portion (35.8%) resides between 1--5MB, with outliers reaching up to 30MB. This suggests two common malware strategies:
-
minimalist payloads designed to evade signature-based detection by reducing surface area
-
bloating techniques to surpass size thresholds of certain scanners that ignore large files due to resource constraints.
Goodware, on the other hand, overwhelmingly clusters under 1MB (86.3%), with a median size of only 84.39KB. This consistency reflects structured software development practices and minimal code bloat, contrasting sharply with malware\'s diversity. Interestingly, both categories show negligible presence above 50MB, indicating such large binaries are rare and not typically used for either benign or malicious purposes. However, protecting against malware is not as simple as just blocking files that are over 50MB. Looking around our machines, we can see benign file sizes way above that (such as games, installers, and other trusted files) that shouldn’t be automatically deleted. Conversely, many libraries which we employ maliciously are above the minimum threshold, indicating that file size alone would not form a reliable rule, but could certainly contribute towards flagging in combination with other indicators.
Malware's higher standard deviation (2.41MB vs. 2.37MB) and median-to-mean size gap (688KB vs. 1.45MB) imply a right-skewed distribution influenced by large, bloated files. These may include packers, resource-stuffed payloads, or multi-stage droppers. Conversely, goodware's smaller gap between median and mean, coupled with a lower mean, reflects tighter control over distribution and fewer anomalies.
Whats interesting here is the obvious usecase between goodware and malware. Whilst goodware aims to avhieve so many different tasks from calculator apps to task managers, malware has a much stricter scope and often is trying to smuggle more malware in. this is a key limitation to our dataset, we do not have the malware family. We cant tell, easily, if a sample is ransomware, a dropper, or an implant itself.
Overall, malware's file size variability underscores its adaptive nature oscillating between stealth and excess while goodware trends show consistency, which can inform baseline profiling for anomaly detection in static analysis pipelines.
Entropy
Another highly discussed component is entropy, specifically Shannon entropy. This is used to measure randomness across data and with malware, encryption is used to protect more stuff the bad guys don't want you to see. For example, consider an executable that wants to execute shellcode to drop an implant... that shellcode will most likely be encrypted.
Below are some tables showing a summary of entropy across the files:
| Category | Total Files | Min Entropy | Max Entropy | Mean Entropy | Median Entropy | Std Dev |
|---|---|---|---|---|---|---|
| Malware | 613879 | 0.0058 | 8 | 6.3702 | 6.6033 | 1.3545 |
| Goodware | 30261 | 0 | 7.9999 | 6.1045 | 6.2981 | 0.7566 |
| Category | Entropy Range | File Count | Percentage |
|---|---|---|---|
| Malware | 0-1 | 5084 | 0.80% |
| Malware | 1-1.5 | 1603 | 0.30% |
| Malware | 1.5-2 | 3828 | 0.60% |
| Malware | 2-2.5 | 4665 | 0.80% |
| Malware | 2.5-3 | 5245 | 0.90% |
| Malware | 3-3.5 | 7069 | 1.20% |
| Malware | 3.5-4 | 6767 | 1.10% |
| Malware | 4-4.5 | 16956 | 2.80% |
| Malware | 4.5-5 | 19947 | 3.20% |
| Malware | 5-5.5 | 40245 | 6.60% |
| Malware | 5.5-6 | 68747 | 11.20% |
| Malware | 6-6.5 | 106131 | 17.30% |
| Malware | 6.5-7 | 118191 | 19.30% |
| Malware | 7-7.5 | 90415 | 14.70% |
| Malware | 7.5-8 | 118986 | 19.40% |
| Goodware | 0-1 | 11 | 0.00% |
| Goodware | 1-1.5 | 0 | 0.00% |
| Goodware | 1.5-2 | 16 | 0.10% |
| Goodware | 2-2.5 | 10 | 0.00% |
| Goodware | 2.5-3 | 77 | 0.30% |
| Goodware | 3-3.5 | 165 | 0.50% |
| Goodware | 3.5-4 | 583 | 1.90% |
| Goodware | 4-4.5 | 594 | 2.00% |
| Goodware | 4.5-5 | 1165 | 3.80% |
| Goodware | 5-5.5 | 2161 | 7.10% |
| Goodware | 5.5-6 | 4392 | 14.50% |
| Goodware | 6-6.5 | 12278 | 40.60% |
| Goodware | 6.5-7 | 7350 | 24.30% |
| Goodware | 7-7.5 | 1228 | 4.10% |
| Goodware | 7.5-8 | 231 | 0.80% |
Malware tends to have higher entropy values on average (mean: 6.37) compared to goodware (mean: 6.10), and this difference becomes more apparent when examining the distribution across entropy ranges.
53.4% of malware samples fall within the 6.5 to 8 entropy range, suggesting that over half of the dataset uses some level of obfuscation or encrypted sections. In contrast, goodware peaks between 6.0 and 6.5 (40.6%) and sharply declines in the higher entropy bins, with only 5% of goodware exceeding 7.0 in entropy.
This pattern supports the hypothesis that high entropy can be a strong indicator of malicious behaviour. However, entropy alone is not a perfect predictor. For example, some benign software (e.g., installers, compressed executables, or cryptographic tools) may naturally exhibit higher entropy. The relatively lower standard deviation in goodware (0.7566) versus malware (1.3545) also indicates that benign files are more consistently structured and less likely to include large, encrypted blobs or random-looking data.
Imports
Next, the imports. In Categorising DLL Exports with an LLM, mez0 took Windows API function and used an LLM to categorise functions from MSDN into groups - the csv mapping file can be found here: https://gist.github.com/mez-0/833314d8e920a17aa3ca703eabbfa4a5
Looking at VirtualAlloc for example, this function is exported from Kernel32.dll and was categorised as such:
| DLL | Function | Description | Category |
|---|---|---|---|
| KERNEL32.DLL | VirtualAlloc | Reserves and commits memory in the virtual address space of a process | Memory Management |
By reviewing imports, we can get a gist of what the file may get up to. The issue here is that there are a few ways to mask this and get the function address and call it dynamically, that is not what we are concerned with here. Below is an example of how imports look in Chrome:
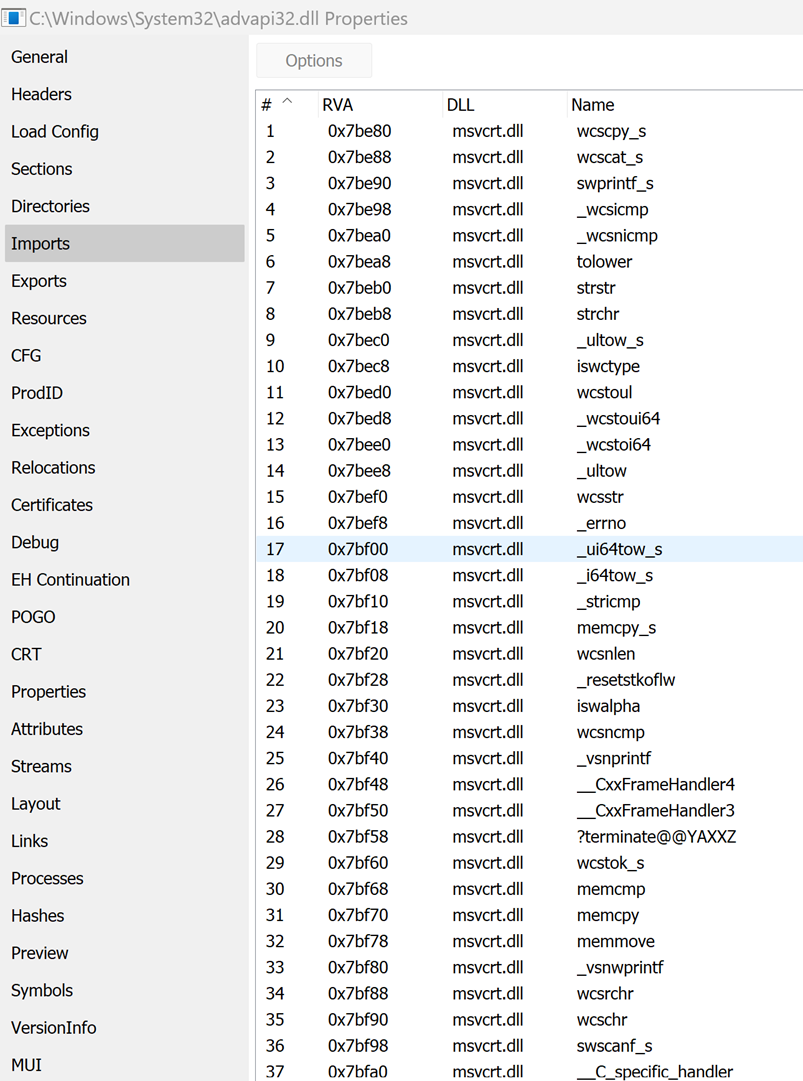
For each sample, we can count how many times an import occurs to get an idea for how common individual calls. With that, we can cross-reference the goodware and look at any key differences.
Malware functions:
| Function | Total Calls | Samples | % of Samples |
|---|---|---|---|
| kernel32.dll!ExitProcess | 415243 | 390812 | 63.66% |
| kernel32.dll!GetModuleHandleA | 370172 | 304720 | 49.64% |
| kernel32.dll!WriteFile | 350280 | 298774 | 48.67% |
| kernel32.dll!LoadLibraryA | 287964 | 286013 | 46.59% |
| kernel32.dll!ReadFile | 306967 | 265799 | 43.30% |
| kernel32.dll!GetModuleFileNameA | 289828 | 254605 | 41.47% |
| kernel32.dll!GetTickCount | 269169 | 254307 | 41.43% |
| kernel32.dll!VirtualAlloc | 282818 | 250326 | 40.78% |
| kernel32.dll!GetStdHandle | 283171 | 246382 | 40.14% |
| kernel32.dll!SetFilePointer | 280856 | 243293 | 39.63% |
| kernel32.dll!FindClose | 263412 | 237305 | 38.66% |
| kernel32.dll!HeapAlloc | 225400 | 225322 | 36.70% |
| kernel32.dll!VirtualFree | 242081 | 222411 | 36.23% |
| kernel32.dll!WaitForSingleObject | 219853 | 219588 | 35.77% |
| kernel32.dll!GetFileSize | 232099 | 217207 | 35.38% |
| kernel32.dll!CreateFileA | 256095 | 214049 | 34.87% |
| kernel32.dll!FreeLibrary | 250137 | 213455 | 34.77% |
| kernel32.dll!WideCharToMultiByte | 226000 | 205958 | 33.55% |
| advapi32.dll!RegCloseKey | 247615 | 200498 | 32.66% |
| user32.dll!MessageBoxA | 230943 | 197857 | 32.23% |
A key observation is that malware samples heavily utilize core Windows kernel functions related to process and file manipulation. Functions such as kernel32.dll!ExitProcess (63.66%), GetModuleHandleA (49.64%), and WriteFile (48.67%) are among the most frequently observed across malware samples. This suggests a reliance on programmatic control of execution flow and I/O operations. Functions like LoadLibraryA and GetProcAddress are also notable for their roles in dynamic code loading and function resolution common techniques used in malware to evade static analysis and enable modular payload delivery.
Goodware functions:
| Function | Total Calls | Samples | % of Samples |
|---|---|---|---|
| kernel32.dll!GetSystemTimeAsFileTime | 15542 | 15542 | 51.36% |
| kernel32.dll!GetCurrentProcessId | 15535 | 15533 | 51.33% |
| kernel32.dll!QueryPerformanceCounter | 15510 | 15474 | 51.14% |
| kernel32.dll!SetUnhandledExceptionFilter | 14942 | 14942 | 49.38% |
| kernel32.dll!UnhandledExceptionFilter | 14513 | 14513 | 47.96% |
| kernel32.dll!IsDebuggerPresent | 13127 | 13127 | 43.38% |
| kernel32.dll!TerminateProcess | 12944 | 12943 | 42.77% |
| kernel32.dll!IsProcessorFeaturePresent | 12343 | 12343 | 40.79% |
| kernel32.dll!RtlVirtualUnwind | 11648 | 11648 | 38.49% |
| kernel32.dll!RtlCaptureContext | 11645 | 11645 | 38.48% |
| kernel32.dll!RtlLookupFunctionEntry | 11626 | 11626 | 38.42% |
| kernel32.dll!InitializeSListHead | 10920 | 10920 | 36.09% |
| kernel32.dll!GetModuleHandleW | 10976 | 10861 | 35.89% |
| kernel32.dll!DeleteCriticalSection | 10770 | 10715 | 35.41% |
| vcruntime140.dll!memset | 9280 | 9280 | 30.67% |
| vcruntime140.dll!__C_specific_handler | 8552 | 8552 | 28.26% |
| vcruntime140.dll!__std_type_info_destroy_list | 7445 | 7445 | 24.60% |
| kernel32.dll!DisableThreadLibraryCalls | 7265 | 7265 | 24.01% |
| kernel32.dll!TlsGetValue | 6874 | 6874 | 22.72% |
| vcruntime140.dll!memcpy | 6498 | 6498 | 21.47% |
In contrast, goodware samples more frequently invoke system introspection and diagnostic functions, including GetSystemTimeAsFileTime (51.36%) and QueryPerformanceCounter (51.14%). These functions are typically used for performance monitoring, logging, and exception handling behaviours expected in legitimate software. The frequent appearance of exception-related functions such as SetUnhandledExceptionFilter and RtlVirtualUnwind further supports the notion that goodware tends to incorporate robust error-handling mechanisms, likely due to higher development standards and testing.
| Function | Malware Calls | Malware Goodware Calls | Goodware Calls | Goodware Samples |
|---|---|---|---|---|
| kernel32.dll!CloseHandle | 377592 | 323275 | 9086 | 8979 |
| kernel32.dll!EnterCriticalSection | 265071 | 235059 | 10770 | 10714 |
| kernel32.dll!GetCurrentProcess | 269276 | 268920 | 13416 | 13416 |
| kernel32.dll!GetCurrentThreadId | 291135 | 258604 | 15791 | 15697 |
| kernel32.dll!GetLastError | 369351 | 316088 | 10381 | 10282 |
| kernel32.dll!GetProcAddress | 401545 | 358065 | 11004 | 10874 |
| kernel32.dll!InitializeCriticalSection | 218748 | 188769 | 6433 | 6378 |
| kernel32.dll!LeaveCriticalSection | 265558 | 235556 | 10796 | 10740 |
| kernel32.dll!MultiByteToWideChar | 232035 | 212398 | 6689 | 6608 |
| kernel32.dll!Sleep | 268710 | 234973 | 8164 | 8041 |
The shared set of functions, such as CloseHandle, GetLastError, and Sleep, appear in both malware and goodware but with significantly higher frequency and volume in malware. This reflects the general-purpose nature of these APIs; they are essential for both benign and malicious applications. However, the disparity in usage frequency may reflect differing operational intensities or structural design. For instance, the disproportionately high number of calls to GetProcAddress in malware (401,545 calls vs. 11,004 in goodware) reinforces the view that dynamic behaviour is a hallmark of malicious code.
Overall, the data suggests that while some API usage is unavoidable and overlaps between goodware and malware, distinct patterns exist in how these functions are employed. Malware tends to leverage APIs that facilitate code injection, persistence, and stealth, whereas goodware tends to use APIs aligned with reliability and diagnostics. This supports the use of API call profiling as a viable feature for malware detection and behavioural classification, provided it accounts for contextual usage and not merely presence or frequency.
Manifest
The manifest section of a file contains the description, trademark, etc. This can be seen under the "Details" tab of any file\'s properties:
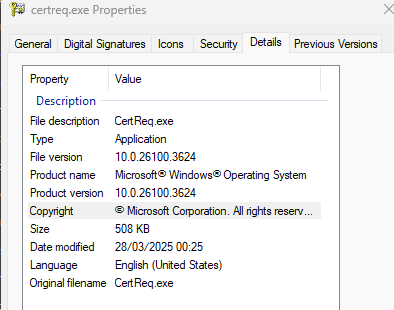
Looking at the dataset, 39.44% of malware binaries (242,122/613,879) have manifests. Compared to 78.94% (23,888/30,261) of goodware. This kind of makes sense... software being provided by legitimate companies will fill this out, why wouldn't you? Whereas in malware, traditionally, theres no point - unless you're trying to blend in.
| Field | Malware Total | Goodware Total | Malware % Coverage | Goodware % Coverage |
|---|---|---|---|---|
| assembly_version | 16,317 | 4,246 | 2.66% | 14.18% |
| comments | 55,394 | 4,419 | 9.02% | 14.61% |
| company_name | 182,491 | 23,019 | 29.71% | 76.05% |
| file_version | 237,630 | 23,791 | 38.71% | 78.60% |
| internal_name | 176,546 | 19,107 | 28.75% | 63.15% |
| legal_copyright | 161,832 | 23,135 | 26.37% | 76.45% |
| legal_trademarks | 27,441 | 1,577 | 4.47% | 5.21% |
| original_file_name | 40 | 22 | 0.01% | 0.07% |
| product_name | 192,966 | 23,318 | 31.43% | 77.08% |
| product_version | 220,469 | 23,608 | 35.91% | 78.03% |
Goodware consistently demonstrates higher metadata completeness, with fields such as file_version, product_version, product_name, and company_name appearing in over 75% of samples. In contrast, these same fields are present in only 26 - 39% of malware samples. This discrepancy may reflect the priorities of legitimate software developers, who are typically subject to compliance, version control, and branding requirements factors largely absent in malicious development practices. Moreover, the near absence of fields like original_file_name in both datasets (0.01% in malware, 0.07% in goodware) suggests limited diagnostic value for certain metadata attributes. Interestingly, while fields such as comments and assembly_version are present in a minority of goodware samples, their even lower presence in malware (2--9%) implies that attackers tend to omit non-functional descriptive metadata, possibly to reduce file size or avoid revealing development artefacts. This divergence in metadata usage may offer a viable heuristic for automated malware classification, though care must be taken to account for adversarial adaptation, where malware authors may spoof or mimic goodware metadata to evade detection.
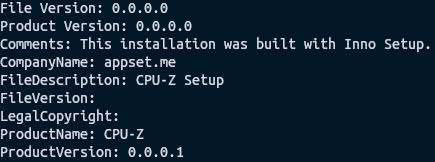
bce48fd0850969f93da9e85a0c65f74b10d85aee68fdf6fe0e65d881f52f69ad was found to contain a manifest, if we dump it, we can see what it contains:
Alternatively, we can look up 70bc155082505cdc0ec08428b39fe03212ff06653549f36cd8a9577202fc20a5 and see how it should be written:
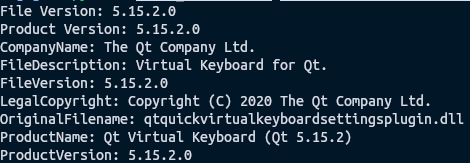
It seems kind of obvious here, but this kind of data should probably be filled out. Granted, it won't secure an implant landing, but it's one less weird thing. So, to conclude, this is basically no effort to add, but it is worth it.
Toolchains
With all of that said and done, none of it would exist without the toolchains. This covers things such as:
-
linker
-
compiler
-
packers
-
etc
The best method for populating this, in our experience, is Detect-it-Easy. Firing it up and pointing it to a sample, we can see a ton of information.
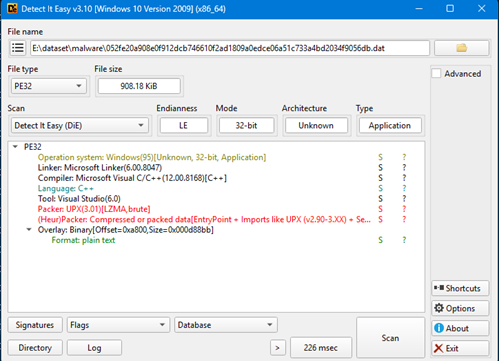
There is also a python binding by elastic. However, it took an incredible amount of time over the sample count and ended up hanging. Effort was made to introduce a timeout wrapper on the python function, but it was still slow. Instead, a .NET application was built to async parse all samples - this worked perfectly fine and took 3 hours to parse all samples. The main command to do this from a CLI is:
diec.exe E:\dataset\malware\ -g -j -U -d --heuristicscan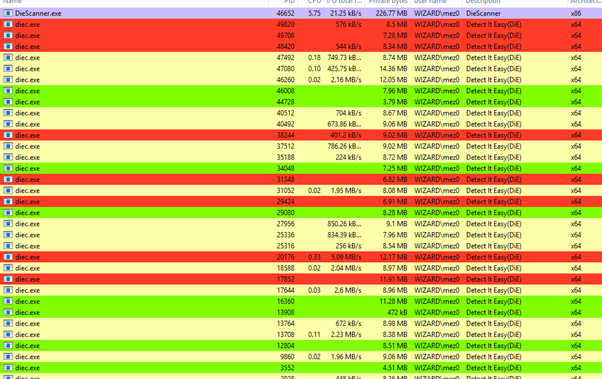
The output from the .NET wrapper:
DIEC Scan Summary - 09/06/2025 01:48:39
==================================================
Total files: 616,524
Successful: 118,415
Failed: 498,109
Success rate: 19.2%
Top error types:
Process timeout: 498,109 files
Let's look through the data from linker, compiler, packer, and protector.
Linker
Analysing the data, we identified that 107,234 samples were able to have their linker identified. This gives us a percentage of 17.46% of samples we collected, were identifiable. Below is the full output:
| Tool | Malware Count | Goodware Count | Total Count | Malware % | Goodware % |
|---|---|---|---|---|---|
| Microsoft Linker | 85,740 | 18,653 | 104,393 | 82.13% | 17.87% |
| Turbo Linker | 8,780 | 156 | 8,936 | 98.25% | 1.75% |
| Polink | 7,468 | 0 | 7,468 | 100.00% | 0.00% |
| GNU Linker ld (GNU Binutils) | 2,228 | 3,511 | 5,739 | 38.82% | 61.18% |
| LCC Linker | 2,401 | 6 | 2,407 | 99.75% | 0.25% |
| Watcom Linker | 536 | 1 | 537 | 99.81% | 0.19% |
| GoLink | 80 | 0 | 80 | 100.00% | 0.00% |
| PowerBASIC Linker | 0 | 8 | 8 | 0.00% | 100.00% |
| Borland TLINK | 0 | 6 | 6 | 0.00% | 100.00% |
| TCC Linker | 1 | 0 | 1 | 100.00% | 0.00% |
Microsoft Linker is prevalent in both categories. This makes sense, the Visual Studio IDE is easy to work with, so why wouldn't most things in general be built with it? Turbo Linker, Polink, LCC Linker, Watcom Linker, GoLink, and TCC Linker are almost exclusively associated with malware (98.25%--100%), indicating these tools are either niche or specifically favoured by malware developers, possibly due to their flexibility or obscurity. Conversely, PowerBASIC and Borland TLINK are used only in goodware (100%), suggesting they are either outdated or tightly controlled, limiting their use in malicious contexts. GNU Linker stands out with a higher goodware percentage (61.18%) than malware (38.82%), likely since its easy to get access to, automate, and is seen in a lot of GitHub projects.
Compiler
Moving onto Compilers, we start to see even more variety.
| Tool | Malware Count | Goodware Count | Total Count | Malware % | Goodware % |
|---|---|---|---|---|---|
| Microsoft Visual C/C++ | 56,642 | 13,276 | 69,918 | 81.01% | 18.99% |
| Visual Basic | 9,384 | 7 | 9,391 | 99.93% | 0.07% |
| Borland Delphi | 8,503 | 78 | 8,581 | 99.09% | 0.91% |
| PureBasic | 7,269 | 277 | 7,546 | 96.33% | 3.67% |
| MASM | 4,187 | 0 | 4,187 | 100.00% | 0.00% |
| Microsoft Visual Basic | 3,776 | 0 | 3,776 | 100.00% | 0.00% |
| MinGW | 2,217 | 1,422 | 3,639 | 60.92% | 39.08% |
| VB.NET | 2,492 | 62 | 2,554 | 97.57% | 2.43% |
| FASM | 1,442 | 0 | 1,442 | 100.00% | 0.00% |
| Watcom C/C++ | 536 | 1 | 537 | 99.81% | 0.19% |
| Embarcadero Delphi | 304 | 35 | 339 | 89.68% | 10.32% |
| Borland C++ | 273 | 40 | 313 | 87.22% | 12.78% |
| LCC-Win32 | 258 | 0 | 258 | 100.00% | 0.00% |
| Free Pascal | 117 | 6 | 123 | 95.12% | 4.88% |
| Borland C/C++ | 0 | 5 | 5 | 0.00% | 100.00% |
| Virtual Pascal | 3 | 0 | 3 | 100.00% | 0.00% |
| Rust | 0 | 2 | 2 | 0.00% | 100.00% |
| Go | 2 | 0 | 2 | 100.00% | 0.00% |
| JScript | 1 | 1 | 2 | 50.00% | 50.00% |
| Visual Objects | 1 | 0 | 1 | 100.00% | 0.00% |
| Intel C/C++ Compiler | 1 | 0 | 1 | 100.00% | 0.00% |
| Tiny C | 1 | 0 | 1 | 100.00% | 0.00% |
Microsoft Visual C/C++ is prevalent in both (81.01% malware, 18.99% goodware). Again, this shows that it has widespread adoption and makes it a common choice for ~malicious~ developers. Tools like MASM, Microsoft Visual Basic, FASM, LCC-Win32, Virtual Pascal, Visual Objects, Intel C/C++ Compiler, Tiny C, and Go are exclusively or nearly exclusively (100% or near 100%) used in malware. However, this will be purely a dataset issue and perhaps speaks to the age of the samples obtained. This then appears again with Visual Basic (99.93% malware) and Borland Delphi (99.09% malware). MinGW (60.92% malware, 39.08% goodware) is often wrapped in open-source tooling, so this is no surprise.
Packer
Packers are used to protect other files by encrypted and/or compressing them into another file. Then, on execution, the original file is fully or partially decrypted/decompressed and loaded into memory. Below is the data we gathered.
| Tool | Malware Count | Goodware Count | Total Count | Malware % | Goodware % |
|---|---|---|---|---|---|
| UPX | 11,758 | 16 | 11,774 | 99.86% | 0.14% |
| Petite | 2,562 | 41 | 2,603 | 98.42% | 1.58% |
| MPRESS | 2,031 | 1 | 2,032 | 99.95% | 0.05% |
| DxPack | 1,632 | 0 | 1,632 | 100.00% | 0.00% |
| NeoLite | 923 | 0 | 923 | 100.00% | 0.00% |
| PECompact | 820 | 1 | 821 | 99.88% | 0.12% |
| ASPack | 741 | 2 | 743 | 99.73% | 0.27% |
| (Win)Upack | 182 | 0 | 182 | 100.00% | 0.00% |
| MEW | 78 | 0 | 78 | 100.00% | 0.00% |
| kkrunchy | 78 | 0 | 78 | 100.00% | 0.00% |
| NsPacK | 36 | 0 | 36 | 100.00% | 0.00% |
| Packman | 32 | 0 | 32 | 100.00% | 0.00% |
| FSG | 21 | 0 | 21 | 100.00% | 0.00% |
| py2exe | 3 | 11 | 14 | 21.43% | 78.57% |
| .NETZ | 9 | 0 | 9 | 100.00% | 0.00% |
| Bat To Exe Converter | 9 | 0 | 9 | 100.00% | 0.00% |
| BeRo | 9 | 0 | 9 | 100.00% | 0.00% |
| Exe32Pack | 3 | 0 | 3 | 100.00% | 0.00% |
| PE-PACK | 3 | 0 | 3 | 100.00% | 0.00% |
| MoleBox | 3 | 0 | 3 | 100.00% | 0.00% |
| CExe | 2 | 0 | 2 | 100.00% | 0.00% |
| WWPACK | 2 | 0 | 2 | 100.00% | 0.00% |
| PyInstaller | 1 | 0 | 1 | 100.00% | 0.00% |
| AHpacker | 1 | 0 | 1 | 100.00% | 0.00% |
| Pack Master | 1 | 0 | 1 | 100.00% | 0.00% |
| XPACK | 1 | 0 | 1 | 100.00% | 0.00% |
| RLPack | 1 | 0 | 1 | 100.00% | 0.00% |
| NakedPacker | 1 | 0 | 1 | 100.00% | 0.00% |
What is interesting is that near 100% of this is malware usage. UPX (11,774 samples, 99.86% malware), Petite (2,603 samples, 98.42% malware), and MPRESS (2,032 samples, 99.95% malware) dominate in sample size. As much as genuine developers want to protect their work, malware authors are slightly more motivated to do so if they are trying to drop an implant or ransomware, for example.
Moreover, py2exe stands out with 78.57% goodware (11 of 14 samples), suggesting its use in legitimate Python-based software development, though its small sample size limits broader conclusions. This would make sense as python code is trivial to read and understand, py2exe whilst not a direct packer, it has the same impact. Other tools, like DxPack (1,632 samples) and NeoLite (923 samples), report 100% malware, but smaller sample sizes (e.g., PyInstaller, 1 sample) reduce the reliability of these percentages.
It's worth noting again, though, the limitations of the datasets which we have here. It was a lot easier to get malware then it was goodware, so the sample size can be more granular.
Protector
If you consider a packer to be something to package up and protect a file, protectors aim to obfusctte the binary itself. Take VMProtect for example, which offers the following list of capabilities:
-
Obfuscation methods
-
Mutation
-
Virtualization
-
Ultra (mutation-virtualization)
-
Protection options
-
Memory protection
-
Import protection
-
Resource protection
-
Packing
-
Debuger detection
-
Virtual tools detection
-
Additional features
-
Console version
-
Watermarks
-
Script language
-
Licensing system
-
Activation system
-
Virtual files
A direct quote:
Secure your code against reverse engineering, analyzing, and cracking. Use the advantage of code virtualization, which executes virtualized fragments of code on several virtual machines embedded into the protected application.
Below is our analysis.
| Tool | Malware Count | Goodware Count | Total Count | Malware % | Goodware % |
|---|---|---|---|---|---|
| VMProtect | 616 | 3 | 619 | 99.52% | 0.48% |
| .NET Reactor | 152 | 29 | 181 | 83.98% | 16.02% |
| Confuser | 156 | 0 | 156 | 100.00% | 0.00% |
| SoftSentry | 151 | 0 | 151 | 100.00% | 0.00% |
| DotFix NiceProtect | 96 | 0 | 96 | 100.00% | 0.00% |
| ENIGMA | 69 | 0 | 69 | 100.00% | 0.00% |
| Smart Assembly | 57 | 10 | 67 | 85.07% | 14.93% |
| Themida/Winlicense | 64 | 0 | 64 | 100.00% | 0.00% |
| Armadillo | 63 | 0 | 63 | 100.00% | 0.00% |
| tElock | 62 | 0 | 62 | 100.00% | 0.00% |
| Crypto Obfuscator | 43 | 3 | 46 | 93.48% | 6.52% |
| Ste@lth PE | 46 | 0 | 46 | 100.00% | 0.00% |
| Thinstall(VMware ThinApp) | 37 | 0 | 37 | 100.00% | 0.00% |
| Fish PE | 32 | 0 | 32 | 100.00% | 0.00% |
| ASProtect | 29 | 0 | 29 | 100.00% | 0.00% |
| NTkrnl Protector | 24 | 0 | 24 | 100.00% | 0.00% |
| Eazfuscator | 22 | 0 | 22 | 100.00% | 0.00% |
| Sixxpack | 21 | 0 | 21 | 100.00% | 0.00% |
| Babel .NET | 19 | 0 | 19 | 100.00% | 0.00% |
| Vbs To Exe | 17 | 0 | 17 | 100.00% | 0.00% |
| Dotfuscator | 12 | 1 | 13 | 92.31% | 7.69% |
| Enigma | 12 | 0 | 12 | 100.00% | 0.00% |
| Phoenix | 11 | 0 | 11 | 100.00% | 0.00% |
| Obfuscar | 10 | 0 | 10 | 100.00% | 0.00% |
| ByteGuard | 10 | 0 | 10 | 100.00% | 0.00% |
| Agile | 8 | 0 | 8 | 100.00% | 0.00% |
| Zprotect | 8 | 0 | 8 | 100.00% | 0.00% |
| PELock | 7 | 0 | 7 | 100.00% | 0.00% |
| eXPressor | 7 | 0 | 7 | 100.00% | 0.00% |
| Obsidium | 6 | 0 | 6 | 100.00% | 0.00% |
| StarForce | 6 | 0 | 6 | 100.00% | 0.00% |
| ARM Protector | 5 | 0 | 5 | 100.00% | 0.00% |
| ACProtect | 5 | 0 | 5 | 100.00% | 0.00% |
| North Star PE Shrinker | 4 | 0 | 4 | 100.00% | 0.00% |
| Safengine Shielden | 4 | 0 | 4 | 100.00% | 0.00% |
| SVK Protector | 4 | 0 | 4 | 100.00% | 0.00% |
| KoiVM | 2 | 0 | 2 | 100.00% | 0.00% |
| Yoda's Protector | 2 | 0 | 2 | 100.00% | 0.00% |
| Break Into Pattern | 2 | 0 | 2 | 100.00% | 0.00% |
| DNGuard | 2 | 0 | 2 | 100.00% | 0.00% |
| PEBundle | 2 | 0 | 2 | 100.00% | 0.00% |
| .BJFnt | 2 | 0 | 2 | 100.00% | 0.00% |
| PC Guard | 2 | 0 | 2 | 100.00% | 0.00% |
| Yano | 2 | 0 | 2 | 100.00% | 0.00% |
| CodeWall | 2 | 0 | 2 | 100.00% | 0.00% |
| PELOCKnt | 1 | 0 | 1 | 100.00% | 0.00% |
| Skater | 1 | 0 | 1 | 100.00% | 0.00% |
| PECRYPT32 | 1 | 0 | 1 | 100.00% | 0.00% |
| ExeStealth | 1 | 0 | 1 | 100.00% | 0.00% |
| DeepSea | 1 | 0 | 1 | 100.00% | 0.00% |
| Ding Boys PE-lock Phantasm | 1 | 0 | 1 | 100.00% | 0.00% |
| AssemblyInvoke | 1 | 0 | 1 | 100.00% | 0.00% |
| Shrinker | 1 | 0 | 1 | 100.00% | 0.00% |
| ConfuserEx | 1 | 0 | 1 | 100.00% | 0.00% |
| MSLRH | 1 | 0 | 1 | 100.00% | 0.00% |
| HyperTech Crackproof | 1 | 0 | 1 | 100.00% | 0.00% |
VMProtect (619 samples, 99.52% malware) leads in sample size, followed by .NET Reactor (181 samples, 83.98% malware) and Confuser (156 samples, 100% malware). Only five tools - VMProtect (0.48% goodware), .NET Reactor (16.02%), Smart Assembly (14.93%), Crypto Obfuscator (6.52%), and Dotfuscator (7.69%) report any goodware, but their goodware percentages are low, and sample sizes vary significantly.
Similarly, as Packers, we see a ton of malware usage here. .NET Reactor and Smart Assembly, with notable goodware percentages, suggest some legitimate use, possibly in .NET-based development, but their malware dominance (83.98% and 85.07%) remains concerning. Tools like Confuser and SoftSentry, with moderate sample sizes and 100% malware, are high-risk candidates for security monitoring.
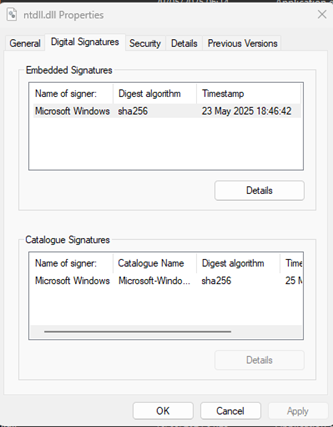
Code Signing
To try and validity to a file, code signing is used. We can see this with the default files included by Microsoft on Windows - consider NTDLL.DLL:
LolCerts was created to try and keep track of certificates that had been leaked, for example the MSI Certificate: MSI Data Breach: Private Code Signing Keys Leaked on the Dark Web
By code signing malware, the operators are hoping that vendors will allow the binary. Whilst writing this blog, we tried to find some official documentation pointing to code signing certificates having a positive impact to evasion, but the only thing we have to reference is experience of "this has worked for us". Below is a count of all the CA's we managed to parse:
| CA Name | Count |
|---|---|
| COMODO RSA Code Signing CA | 804 |
| COMODO RSA Certification Authority | 557 |
| Symantec Time Stamping Services CA - G2 | 264 |
| Symantec Time Stamping Services Signer - G4 | 264 |
| AddTrust External CA Root | 248 |
| COMODO SHA-1 Time Stamping Signer | 227 |
| GlobalSign CodeSigning CA - SHA256 - G3 | 176 |
| VeriSign Class 3 Code Signing 2010 CA | 164 |
| Symantec Class 3 SHA256 Code Signing CA | 159 |
| VeriSign Time Stamping Services CA | 156 |
| Microsoft Root Authority | 150 |
| Freemium GmbH | 132 |
| Cloud Installer | 130 |
| WoSign Time Stamping Signer | 125 |
| Qihoo 360 Software (Beijing) Company Limited | 121 |
| Microsoft Timestamping Service | 108 |
| VeriSign Class 3 Code Signing 2004 CA | 106 |
| Dummy certificate | 106 |
| APPSET | 100 |
| VeriSign Time Stamping Services Signer | 96 |
| thawte SHA256 Code Signing CA | 96 |
| Adobe Systems | 95 |
| freemium GmbH | 91 |
| thawte Primary Root CA | 89 |
| VeriSign Class 3 Public Primary Certification Authority - G5 | 81 |
| Microsoft Timestamping PCA | 77 |
| Microsoft Corporation | 76 |
| Microsoft Code Signing PCA | 70 |
| SpringTech Ltd | 69 |
| COMODO Code Signing CA 2 | 64 |
| Thawte Code Signing CA - G2 | 60 |
| VeriSign Time Stamping Services Signer - G2 | 50 |
| UTN-USERFirst-Object | 48 |
| PC Utilities Software Limited | 44 |
| GlobalSign Timestamping CA - G2 | 41 |
As interesting as that is, it's more of a FYI. Here is the meat and potatoes: of the 613,879 samples of malware, we found that 568,456 (92.61%) of the samples were unsigned, and 45,423 (7.39%) of the samples were signed. Conversely, of the 30,261 goodware samples, 9,490 (31.36%) were unsigned and 20,771 (68.64%) were signed. So, goodware tends to be signed often whereas for malware the opposite is the apparent case. So again, we cannot definitively prove that signing will make a difference or that it would be the sole reason that you can blend in, but it does act as yet another thing that will help a binary blend in more. However, getting a code signing certificate is difficult; while ADCS can give them out, we don't see any research showing the impact of signing a file with an internal ADCS code-sign certificate, whereas compromised certificates and known-bad issues would clearly not be a good inclusion. The thing to note is that even legitimate services use commercially available developer certificates which are add to the air of authenticity and further divorce a binary from the malware aesthetic.
| Type | Issuer | Count | Serial Number |
|---|---|---|---|
| malware | CN=COMODO RSA Certification Authority,O=COMODO CA Limited,L=Salford,ST=Greater Manchester,C=GB | 17233 | 61791086908916947884024501610337875119 |
| malware | CN=COMODO RSA Certification Authority,O=COMODO CA Limited,L=Salford,ST=Greater Manchester,C=GB | 6232 | 101909084537582093308941363524873193117 |
| malware | CN=AddTrust External CA Root,OU=AddTrust External TTP Network,O=AddTrust AB,C=SE | 5945 | 52374340215108295845375962883522092578 |
| malware | CN=AddTrust External CA Root,OU=AddTrust External TTP Network,O=AddTrust AB,C=SE | 5494 | 1 |
| malware | CN=Symantec Time Stamping Services CA - G2,O=Symantec Corporation,C=US | 5342 | 19688950797630895426199952712430983760 |
| malware | CN=Thawte Timestamping CA,OU=Thawte Certification,O=Thawte,L=Durbanville,ST=Western Cape,C=ZA | 5325 | 168250781398245547403531165097821404219 |
| malware | CN=UTN-USERFirst-Object,OU=http://www.usertrust.com,O=The USERTRUST Network,L=Salt Lake City,ST=UT,C=US | 4127 | 117007971038687812527568897756771083 |
| malware | CN=GlobalSign,O=GlobalSign,OU=GlobalSign Root CA - R3 | 3993 | 1462505465907667685259976282102477 |
| malware | CN=Microsoft Root Authority,OU=Microsoft Corporation,OU=Copyright (c) 1997 Microsoft Corp. | 3481 | 3914548144742538765706922673626944 |
| malware | CN=Thawte Timestamping CA,OU=Thawte Certification,O=Thawte,L=Durbanville,ST=Western Cape,C=ZA | 3410 | 95367435335131489231313444090147582372 |
| malware | CN=VeriSign Class 3 Public Primary Certification Authority - G5,OU=(c) 2006 VeriSign, Inc. - For authorized use only,OU=VeriSign Trust Network,O=VeriSign, Inc.,C=US | 3270 | 81710363848389238104995526639509734954 |
| malware | CN=COMODO RSA Code Signing CA,O=COMODO CA Limited,L=Salford,ST=Greater Manchester,C=GB | 2934 | 96929902786164039751057176698743692889 |
| malware | CN=VeriSign Class 3 Public Primary Certification Authority - G5,OU=(c) 2006 VeriSign, Inc. - For authorized use only,OU=VeriSign Trust Network,O=VeriSign, Inc.,C=US | 2743 | 109001353806506068745144901449045193671 |
| malware | CN=GlobalSign CodeSigning CA - SHA256 - G3,O=GlobalSign nv-sa,C=BE | 2637 | 8240380941626947394907749311 |
| malware | CN=Certification Authority of WoSign,O=WoSign CA Limited,C=CN | 2407 | 49344295393511144818278722224547446860 |
| malware | CN=Root Agency | 2307 | 160647940116102772061935198811329157007 |
| malware | CN=Microsoft Timestamping PCA,O=Microsoft Corporation,L=Redmond,ST=Washington,C=US | 2298 | 458441701260288556269574 |
| malware | OU=Class 3 Public Primary Certification Authority,O=VeriSign, Inc.,C=US | 2284 | 87155975386774669517273893148021257666 |
| malware | CN=VeriSign Time Stamping Services CA,O=VeriSign, Inc.,C=US | 2231 | 18490660337486627817154717305594869384 |
| malware | CN=Unknown issuer | 2216 | 1 |
| goodware | CN=DigiCert Trusted Root G4,OU=www.digicert.com,O=DigiCert Inc,C=US | 7473 | 11533403529598586876501374841704918745 |
| goodware | CN=DigiCert Assured ID Root CA,OU=www.digicert.com,O=DigiCert Inc,C=US | 4383 | 5364131601516814570659357524942475272 |
| goodware | CN=DigiCert Trusted Root G4,OU=www.digicert.com,O=DigiCert Inc,C=US | 3290 | 9586110043380832440035821245782711899 |
Conclusion
The dataset was a bit of a chore to obtain, across both goodware and malware but we did what we could, and we are always looking to still ingest more. Of the two, malware is easier to come by, than goodware and less problematic to distribute (from a licensing perspective), but equally may be somewhat modified depending on the state and source.
Our main initial takeaway from this would be that if you act like a legitimate developer, you look like one too.
That key differentiation between the two datapoints makes for an interesting comparison. However, we noted that for a binary to best blend in, it’s going to sound obvious, but develop more like developers. Malware built and setup properly with tools like Visual Studio with all the right resources, looks a lot more genuine. Trying to blend into the grey between malware and goodware is preferable. If any detection logic is written purely on “if no manifest”, then the rule deserves to be broken and hopefully vendors writing poor logic like that can learn something. As with all our blogs, we don’t want to give you the surefire results to build better malware, if you read the blog end to end and are capable, you will know what to improve.